6.6.4 Using the ExtractCurve() Function
The ExtractCurve() function copies a curve from a previous report onto a graph in the current test report. To accomplish this, the function uses the entire test label to look up the previously run test and then searches for the curve name in that report. If a matching curve name is found, the curve is copied to the specified graph in the current report. If no matching curve name match is found, a warning message appears in the SIMetrix/SIMPLIS command shell.
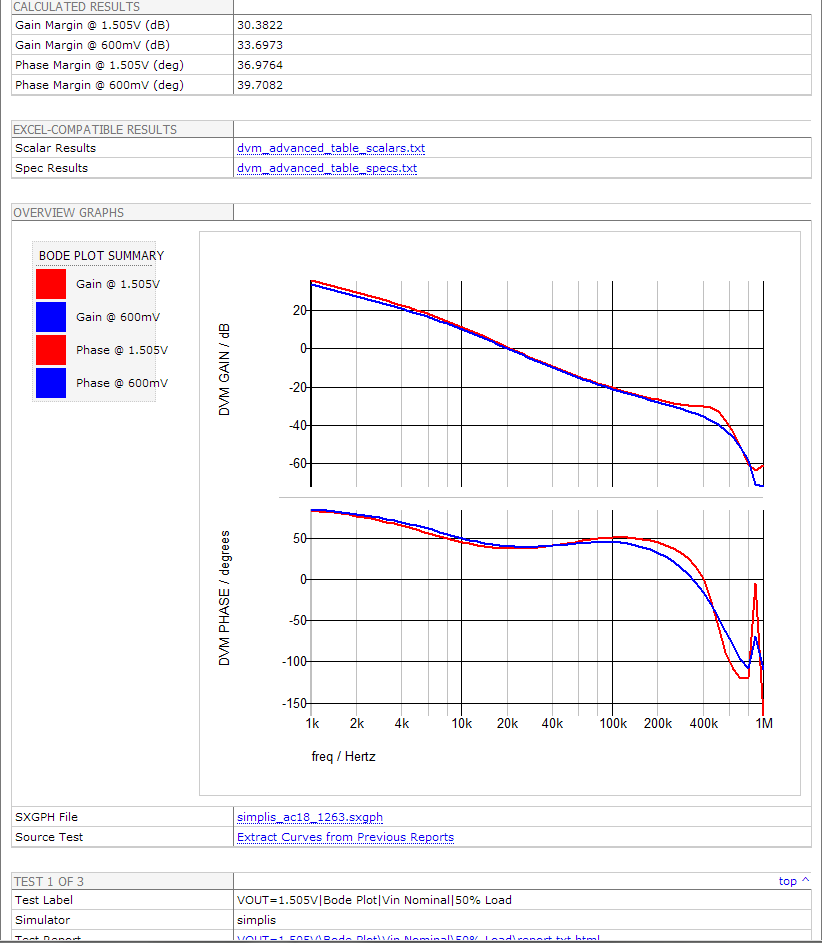
In 6.5.2 Promoting Scalars to the Overview Report, you used the PromoteGraph() and PromoteScalar() functions to place graphs and scalars on the overview report. The overview scalar values for gain_margin and phase_margin could easily be compared in the CALCULATED RESULTS section, but the curves on two different graphs were harder to compare.
6.6.4.1 Preparing the Testplan
To prepare a new testplan to copy curves from the previous testplan and to promote the new graph to the overview report, follow these steps:
- Open the testplan from SIMPLIS_dvm_tutorial_examples.zip at this path: 6.5.2_promotescalar_final.testplan.
- Delete the two columns containing the PromoteGraph() functions.
- Add three columns after the Jumper column and type Create in each header row.
- Add two rows at the bottom of the testplan; put *** in the first new row and enter
the following in the last row:
- First column: No simulation
- Last column: Extract Curves from Previous Reports
Note: When you run this test, the simulation is skipped and the post-processing creates the summary curves. Your testplan should now look similar to the following with the above changes in red:
| *** | |||||||||||
|---|---|---|---|---|---|---|---|---|---|---|---|
| *** 6.6.4_extractcurve_start.testplan: extractcurve testplan for DVM tutorial section 6.6.4 | |||||||||||
| *** | |||||||||||
| *?@ Analysis | Objective | Jumper | Create | Create | Create | Create | Promote | Promote | Source | Load | Label |
| *** | |||||||||||
| *** | |||||||||||
| *** | |||||||||||
| *** | |||||||||||
| *** | |||||||||||
| Ac | BodePlot(OUTPUT:1) | Close(J1) | Source(INPUT:1, Nominal) | Load(OUTPUT:1, Light) | VOUT=1.505V|Bode Plot|Vin Nominal|Light Load | ||||||
| Ac | BodePlot(OUTPUT:1) | Close(J1) | PromoteScalar( gain_margin, Gain Margin @ 1.505V (dB)) | PromoteScalar( phase_margin, Phase Margin @ 1.505V (deg)) | Source(INPUT:1, Nominal) | Load(OUTPUT:1, 50%) | VOUT=1.505V|Bode Plot|Vin Nominal|50% Load | ||||
| Ac | BodePlot(OUTPUT:1) | Close(J1) | Source(INPUT:1, Nominal) | Load(OUTPUT:1, 100%) | VOUT=1.505V|Bode Plot|Vin Nominal|100% Load | ||||||
| Ac | BodePlot(OUTPUT:1) | Open(J1) | Source(INPUT:1, Nominal) | Load(OUTPUT:1, Light) | VOUT=0.6V|Bode Plot|Vin Nominal|Light Load | ||||||
| Ac | BodePlot(OUTPUT:1) | Open(J1) | PromoteScalar( gain_margin, Gain Margin @ 600mV (dB)) | PromoteScalar( phase_margin, Phase Margin @ 600mV (deg)) | Source(INPUT:1, Nominal) | Load(OUTPUT:1, 50%) | VOUT=0.6V|Bode Plot|Vin Nominal|50% Load | ||||
| Ac | BodePlot(OUTPUT:1) | Open(J1) | Source(INPUT:1, Nominal) | Load(OUTPUT:1, 100%) | VOUT=0.6V|Bode Plot|Vin Nominal|100% Load | ||||||
| No Simulation | Extract Curves from Previous Reports | ||||||||||
6.6.4.2 Composing the ExtractCurve Functions
Since each ExtractCurve() function copies a single curve, you need to compose four functions:
- Two for the nominal test
- Two for the 600mV output voltage tests
ExtractCurve(label, curve_name_to_extract, new_curve_name, graph_name, grid_index, axis_name, OPTIONAL_PARAMETER_STRING)
| Arg # | Argument Name | Description |
| 1 | label | Report label on the previously run test |
| 2 | curve_name_to_extract | Name of the curve to extract |
| 3 | new_curve_name | New name for the curve Note: For your curve to
appear in the report, you must prefix the curve name with "DVM".
|
| 4 | graph_name | Name of the graph for the new test report* |
| 5 | grid_index | Grid on which to place the curve* |
| 6 | axis_name | Axis on a particular grid* |
| 7 | OPTIONAL_PARAMETER_STRING | A space-separated set of KEY=VALUE pairs that define additional parameters** |
* For additional information about graph_name, grid_index, and axis_name, see Graph Address System.
** For additional information about the OPTIONAL_PARAMETER_STRING, see Optional Parameters.
To assign the arguments for the phase curve generated by the nominal output voltage test, use the values in bold in the following table:
| Argument | Value / Notes |
| label |
VOUT=1.505V|Bode Plot|Vin Nominal|50% Load Identifies previous report |
| curve_name |
DVM Phase Name of curve in previous report |
| new_curve_name |
DVM Phase@1.505V Describes test conditions to help distinguish it from gain curve |
| graph_name |
Bode Plot Summary Name of graph on report |
| grid_index |
A1 Represents the first (lowest) analog grid at bottom of graph |
| axis_name |
bodephase Name used by a fixed schematic probe |
| OPTIONAL_PARAMETER_STRING |
xScale=log color=red Sets the x axis to log scale and specifies the curve color as red. |
ExtractCurve(VOUT=1.505V|Bode Plot|Vin Nominal|50% Load,DVM Phase,DVM Phase@1.505V,Bode Plot Summary,A1,bodephase, xScale=log color=red)
To create the function for the gain curve, follow these steps:
- Make a copy of the above function for the phase curve.
- Replace all instances of Phase with Gain.
- Change the grid index from A1 to A2.
- Change the axis name from bodephase to bodemag.
ExtractCurve(VOUT=1.505V|Bode Plot|Vin Nominal|50% Load, DVM Gain, DVM Gain@1.505V,Bode Plot Summary,A2,bodemag, xScale=log color=red)
At this point, you have composed the ExtractCurve functions for the first test. To compose the function for the second test, follow these steps.
- Duplicate both of the functions above for the phase and gain curves.
- In both of the duplicates, change the label from VOUT=1.505V|Bode Plot|Vin Nominal|50% Load to VOUT=0.6V|Bode Plot|Vin Nominal|50% Load.
- In the curve names, replace 1.505V with 600mV.
- In the optional parameter string, change the color from red to blue.
- In the first four empty Create columns of the last row, add the four ExtractCurve()
functions with the above changes, which are shown below:
*** *** 6.6.4_extractcurve_final.testplan: extractcurve testplan for DVM tutorial section 6.6.4 *** *?@ Analysis Objective Jumper Create Create Create Create Promote Promote Source Load Label *** *** *** *** *** Ac BodePlot(OUTPUT:1) close(J1) SOURCE(INPUT:1, Nominal) LOAD(OUTPUT:1, Light) VOUT=1.505V|Bode Plot|Vin Nominal|Light Load Ac BodePlot(OUTPUT:1) close(J1) PromoteScalar( gain_margin , Gain Margin @ 1.505V (dB)) PromoteScalar( phase_margin , Phase Margin @ 1.505V (deg)) SOURCE(INPUT:1, Nominal) LOAD(OUTPUT:1, 50%) VOUT=1.505V|Bode Plot|Vin Nominal|50% Load Ac BodePlot(OUTPUT:1) close(J1) SOURCE(INPUT:1, Nominal) LOAD(OUTPUT:1, 100%) VOUT=1.505V|Bode Plot|Vin Nominal|100% Load Ac BodePlot(OUTPUT:1) open(J1) SOURCE(INPUT:1, Nominal) LOAD(OUTPUT:1, Light) VOUT=0.6V|Bode Plot|Vin Nominal|Light Load Ac BodePlot(OUTPUT:1) open(J1) PromoteScalar( gain_margin , Gain Margin @ 600mV (dB)) PromoteScalar( phase_margin , Phase Margin @ 600mV (deg)) SOURCE(INPUT:1, Nominal) LOAD(OUTPUT:1, 50%) VOUT=0.6V|Bode Plot|Vin Nominal|50% Load Ac BodePlot(OUTPUT:1) open(J1) SOURCE(INPUT:1, Nominal) LOAD(OUTPUT:1, 100%) VOUT=0.6V|Bode Plot|Vin Nominal|100% Load NoSimulation ExtractCurve(VOUT=1.505V|Bode Plot|Vin Nominal|50% Load,DVM Phase,DVM Phase@1.505V,Bode Plot Summary,A,bodephase,xScale=log color=red ) ExtractCurve(VOUT=1.505V|Bode Plot|Vin Nominal|50% Load,DVM Gain,DVM Gain@1.505V,Bode Plot Summary,A2,bodemag,xScale=log color=red) ExtractCurve(VOUT=0.6V|Bode Plot|Vin Nominal|50% Load,DVM Phase,DVM Phase@600mV,Bode Plot Summary,A1,bodephase,xScale=log color=blue) ExtractCurve(VOUT=0.6V|Bode Plot|Vin Nominal|50% Load,DVM Gain,DVM Gain@600mV,Bode Plot Summary,A2,bodemag,xScale=log color=blue) PromoteGraph(Bode Plot Summary) Extract Curves from Previous Reports - To complete the testplan, add the following in the fifth Create column on the last
row:
PromoteGraph(Bode Plot Summary)
Result: The testplan should now look similar to the following with the changes in red. This testplan is available from SIMPLIS_dvm_tutorial_examples.zip at this path: testplans/6.6.4_extractcurve_final.testplan
| *** | |||||||||||
|---|---|---|---|---|---|---|---|---|---|---|---|
| *** 6.6.4_extractcurve_final.testplan: extractcurve testplan for DVM tutorial section 6.6.4 | |||||||||||
| *** | |||||||||||
| *?@ Analysis | Objective | Jumper | Create | Create | Create | Create | Promote | Promote | Source | Load | Label |
| *** | |||||||||||
| *** | |||||||||||
| *** | |||||||||||
| *** | |||||||||||
| *** | |||||||||||
| Ac | BodePlot(OUTPUT:1) | close(J1) | SOURCE(INPUT:1, Nominal) | LOAD(OUTPUT:1, Light) | VOUT=1.505V|Bode Plot|Vin Nominal|Light Load | ||||||
| Ac | BodePlot(OUTPUT:1) | close(J1) | PromoteScalar( gain_margin , Gain Margin @ 1.505V (dB)) | PromoteScalar( phase_margin , Phase Margin @ 1.505V (deg)) | SOURCE(INPUT:1, Nominal) | LOAD(OUTPUT:1, 50%) | VOUT=1.505V|Bode Plot|Vin Nominal|50% Load | ||||
| Ac | BodePlot(OUTPUT:1) | close( J1 ) | SOURCE(INPUT:1, Nominal) | LOAD(OUTPUT:1, 100%) | VOUT=1.505V|Bode Plot|Vin Nominal|100% Load | ||||||
| Ac | BodePlot(OUTPUT:1) | open(J1) | SOURCE(INPUT:1, Nominal) | LOAD(OUTPUT:1, Light) | VOUT=0.6V|Bode Plot|Vin Nominal|Light Load | ||||||
| Ac | BodePlot(OUTPUT:1) | open(J1) | PromoteScalar( gain_margin , Gain Margin @ 600mV (dB)) | PromoteScalar( phase_margin , Phase Margin @ 600mV (deg)) | SOURCE(INPUT:1, Nominal) | LOAD(OUTPUT:1, 50%) | VOUT=0.6V|Bode Plot|Vin Nominal|50% Load | ||||
| Ac | BodePlot(OUTPUT:1) | open(J1) | SOURCE(INPUT:1, Nominal) | LOAD(OUTPUT:1, 100%) | VOUT=0.6V|Bode Plot|Vin Nominal|100% Load | ||||||
| No Simulation | ExtractCurve(VOUT=1.505V|Bode Plot|Vin Nominal|50% Load,DVM Phase,DVM Phase@1.505V,Bode Plot Summary,A1, bodephase,xScale=log color=red) | ExtractCurve(VOUT=1.505V|Bode Plot|Vin Nominal|50% Load,DVM Gain,DVM Gain@1.505V,Bode Plot Summary,A2,bodemag,xScale=log color=red) | ExtractCurve(VOUT=0.6V|Bode Plot|Vin Nominal|50% Load,DVM Phase,DVM Phase@600mV,Bode Plot Summary,A1,bodephase,xScale=log color=blue) | ExtractCurve(VOUT=0.6V|Bode Plot|Vin Nominal|50% Load,DVM Gain,DVM Gain@600mV,Bode Plot Summary,A2,bodemag,xScale=log color=blue) | PromoteGraph(Bode Plot Summary) | Extract Curves from Previous Reports | |||||
6.6.4.3 Running the Testplan
To run the testplan from the schematic in section 6.3, follow these steps:
- Open the schematic from SIMPLIS_dvm_tutorial_examples.zip at this path: LTC3406B/6.3_LTC3406B - DVM ADVANCED.sxsch.
- Select DVM ▶ Run ▶ Choose Testplan... from the main menu of the schematic editor.
- Navigate to the directory where you extracted SIMPLIS_dvm_tutorial_examples.zip , and select LTC3406B/6.3_LTC3406B - DVM ADVANCED.sxsch
- In both the VOUT=0.6V and VOUT=1.505V lists, check only the 100% load test. Result: The overview report contains the following:
- The Bode plot summary graph with four curves.
- The calculated results section with the four measured scalar values for gain and phase margin
6.6.4.4 Handling Errors and Warnings
After tests are selected but before the testplan is executed, DVM audits the testplan for syntax and for any tests not selected, but required, by later tests. For example, if you before run the same testplan you selected only the summary and the test labeled VOUT=1.505V|Bode Plot|Vin Nominal|50% Load, the following errors would appear in the SIMetrix/SIMPLIS command shell:
After tests are selected to be run but before the testplan is executed, DVM audits the testplan for syntax and checks for any tests not selected, but required, by later tests. For example, assume that you run the same testplan that you ran before, but selected only these two tests:
- Extract Curves from Previous Reports
- VOUT=1.505V|Bode Plot|Vin Nominal|50% Load
In that case, the following errors would appear in the SIMetrix/SIMPLIS command shell:
Test #2 attempts to extract a curve from a test with the label
VOUT=0.6V|Bode Plot|Vin Nominal|50% Load which is not selected to have been run
before Test #2 is set to be executed.

Test #2 attempts to extract a curve from a test with the label
VOUT=0.6V|Bode Plot|Vin Nominal|50% Load which is not selected to have been run
before Test #2 is set to be executed.
These two errors, one for each ExtractCurve() function, warn you that the final graph might not have all the curves that you expect to find since you did not run the entire testplan.